


Hey everyone! I stumbled across a really cool chart that I just have to share with you. It’s from Mike DelPrete, who’s a real estate tech strategist at the University of Colorado Boulder. He put together something called the DelPrete Probability Paradox, and it really nails what a lot of us have been thinking and feeling in our industry lately.
Quick backstory: I met Mike briefly at a conference—he probably wouldn’t remember me—but I’m convinced we’d be besties if we ever had the chance to geek out together. His work, especially this chart, totally resonates with what’s going on in our world right now.
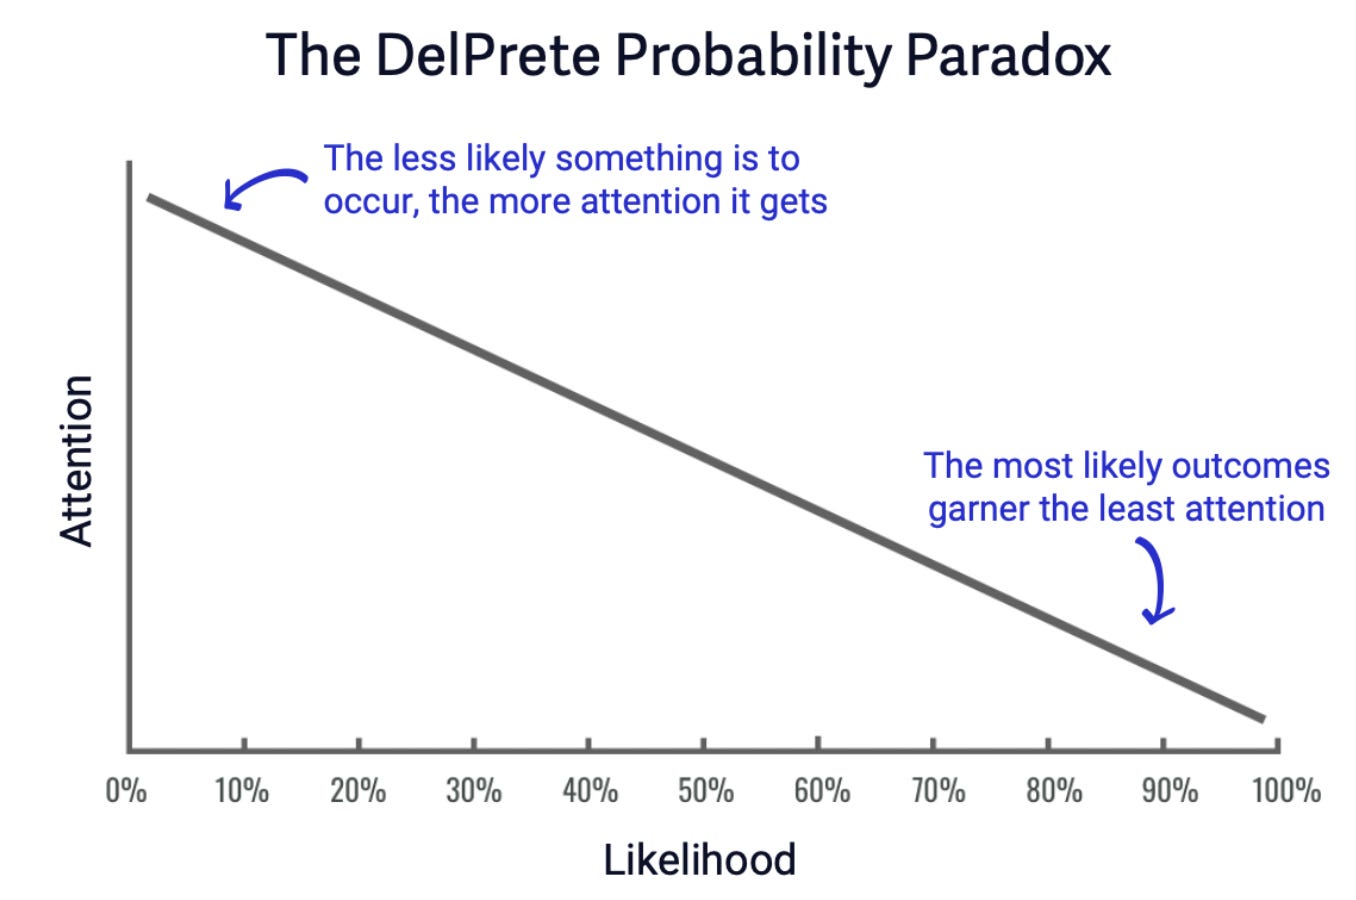
The DelPrete Probability Paradox: What’s It All About?
So, the chart is this super-smart tool that shows how much attention a scenario gets compared to how likely it is to actually happen. I first saw it back in April when there was all this buzz about big changes in our industry—like the NAR settlements and the DOJ getting involved. Now that we’re right in the middle of these changes, I thought it was a great time to bring this chart back into the conversation.
What I love about this chart is that it’s a great reminder that the stuff that gets the most attention isn’t usually what actually happens. With all the new paperwork and rules we’re dealing with, it’s easy to get caught up in these “what if” scenarios that everyone’s talking about, even though they’re not super likely.
How It Applies to Us
Lately, in our meetings and roadshows, I’ve noticed how these low-probability scenarios can take over the conversation. People ask about situations that, while possible, hardly ever happen. For instance, out of 50 transactions, maybe one or two are really challenging or weird. But most of the time, things go pretty smoothly for both the agent and the client.
Those rare cases—the ones I jokingly call “one-time at band camp” scenarios—definitely deserve attention, but we can’t let them overshadow the more typical, drama-free transactions that make up most of our work. The DelPrete Probability Index is a great way to keep things in perspective, helping us as leaders guide our teams through the noise.
Keeping Our Cool
I’ll be honest—I’ve had my own moments of getting worked up over these “what if” scenarios, especially during the roadshows. Even though I know the paperwork inside and out and feel good about what we’re explaining, I still catch myself worrying about those unexpected questions that might come up. It’s a good reminder that we all need to manage the stories we tell ourselves, especially when we’re dealing with something new or a bit uncomfortable.
Mike’s chart also reminded me of a great exercise from Dan Elzer’s classes. He gets agents to write down the absolute worst, best, and most likely outcomes of a scenario—like knocking on a door or making a cold call. It’s such a simple way to help agents shift their mindset, focusing on what’s most likely to happen instead of what’s most terrifying.
Trying It Out
In my upcoming meetings, I’m planning to tweak Dan’s exercise for our team. I’m going to ask agents to think back on their last five or ten transactions—Were they smooth? Were they challenging? By looking at what’s already happened, they’ll have a better idea of what to expect moving forward, and thanks to Mike’s chart, they’ll realize it’s usually the more typical transactions that come up.
As leaders, it’s on us to help our teams feel confident, stay in control, and keep calm when things get chaotic. Whether it’s using visual tools like the DelPrete Probability Index, doing mindset exercises, or just encouraging some reflection, we can help them focus on what’s likely, not just what’s possible.
Wrapping It Up
I hope this little dive into Mike’s chart gives you some helpful insights as you prep for your own meetings and conversations. I’d love to hear what you think—Does this chart click with you? Have you tried any similar exercises with your team? Let me know in the comments below!
And if you’re curious to check out Mike DelPrete’s full article on this, you can find it here.
Thanks for sticking with me through this chat about nerdy charts and the stories we tell ourselves. I hope it was helpful, and I’m looking forward to hearing your thoughts. Have a great day!
— Anna Marie

Share this post